- Sort Score
- Result 10 results
- Languages All
Results 1 - 10 of 13 for dashboard (0.21 sec)
-
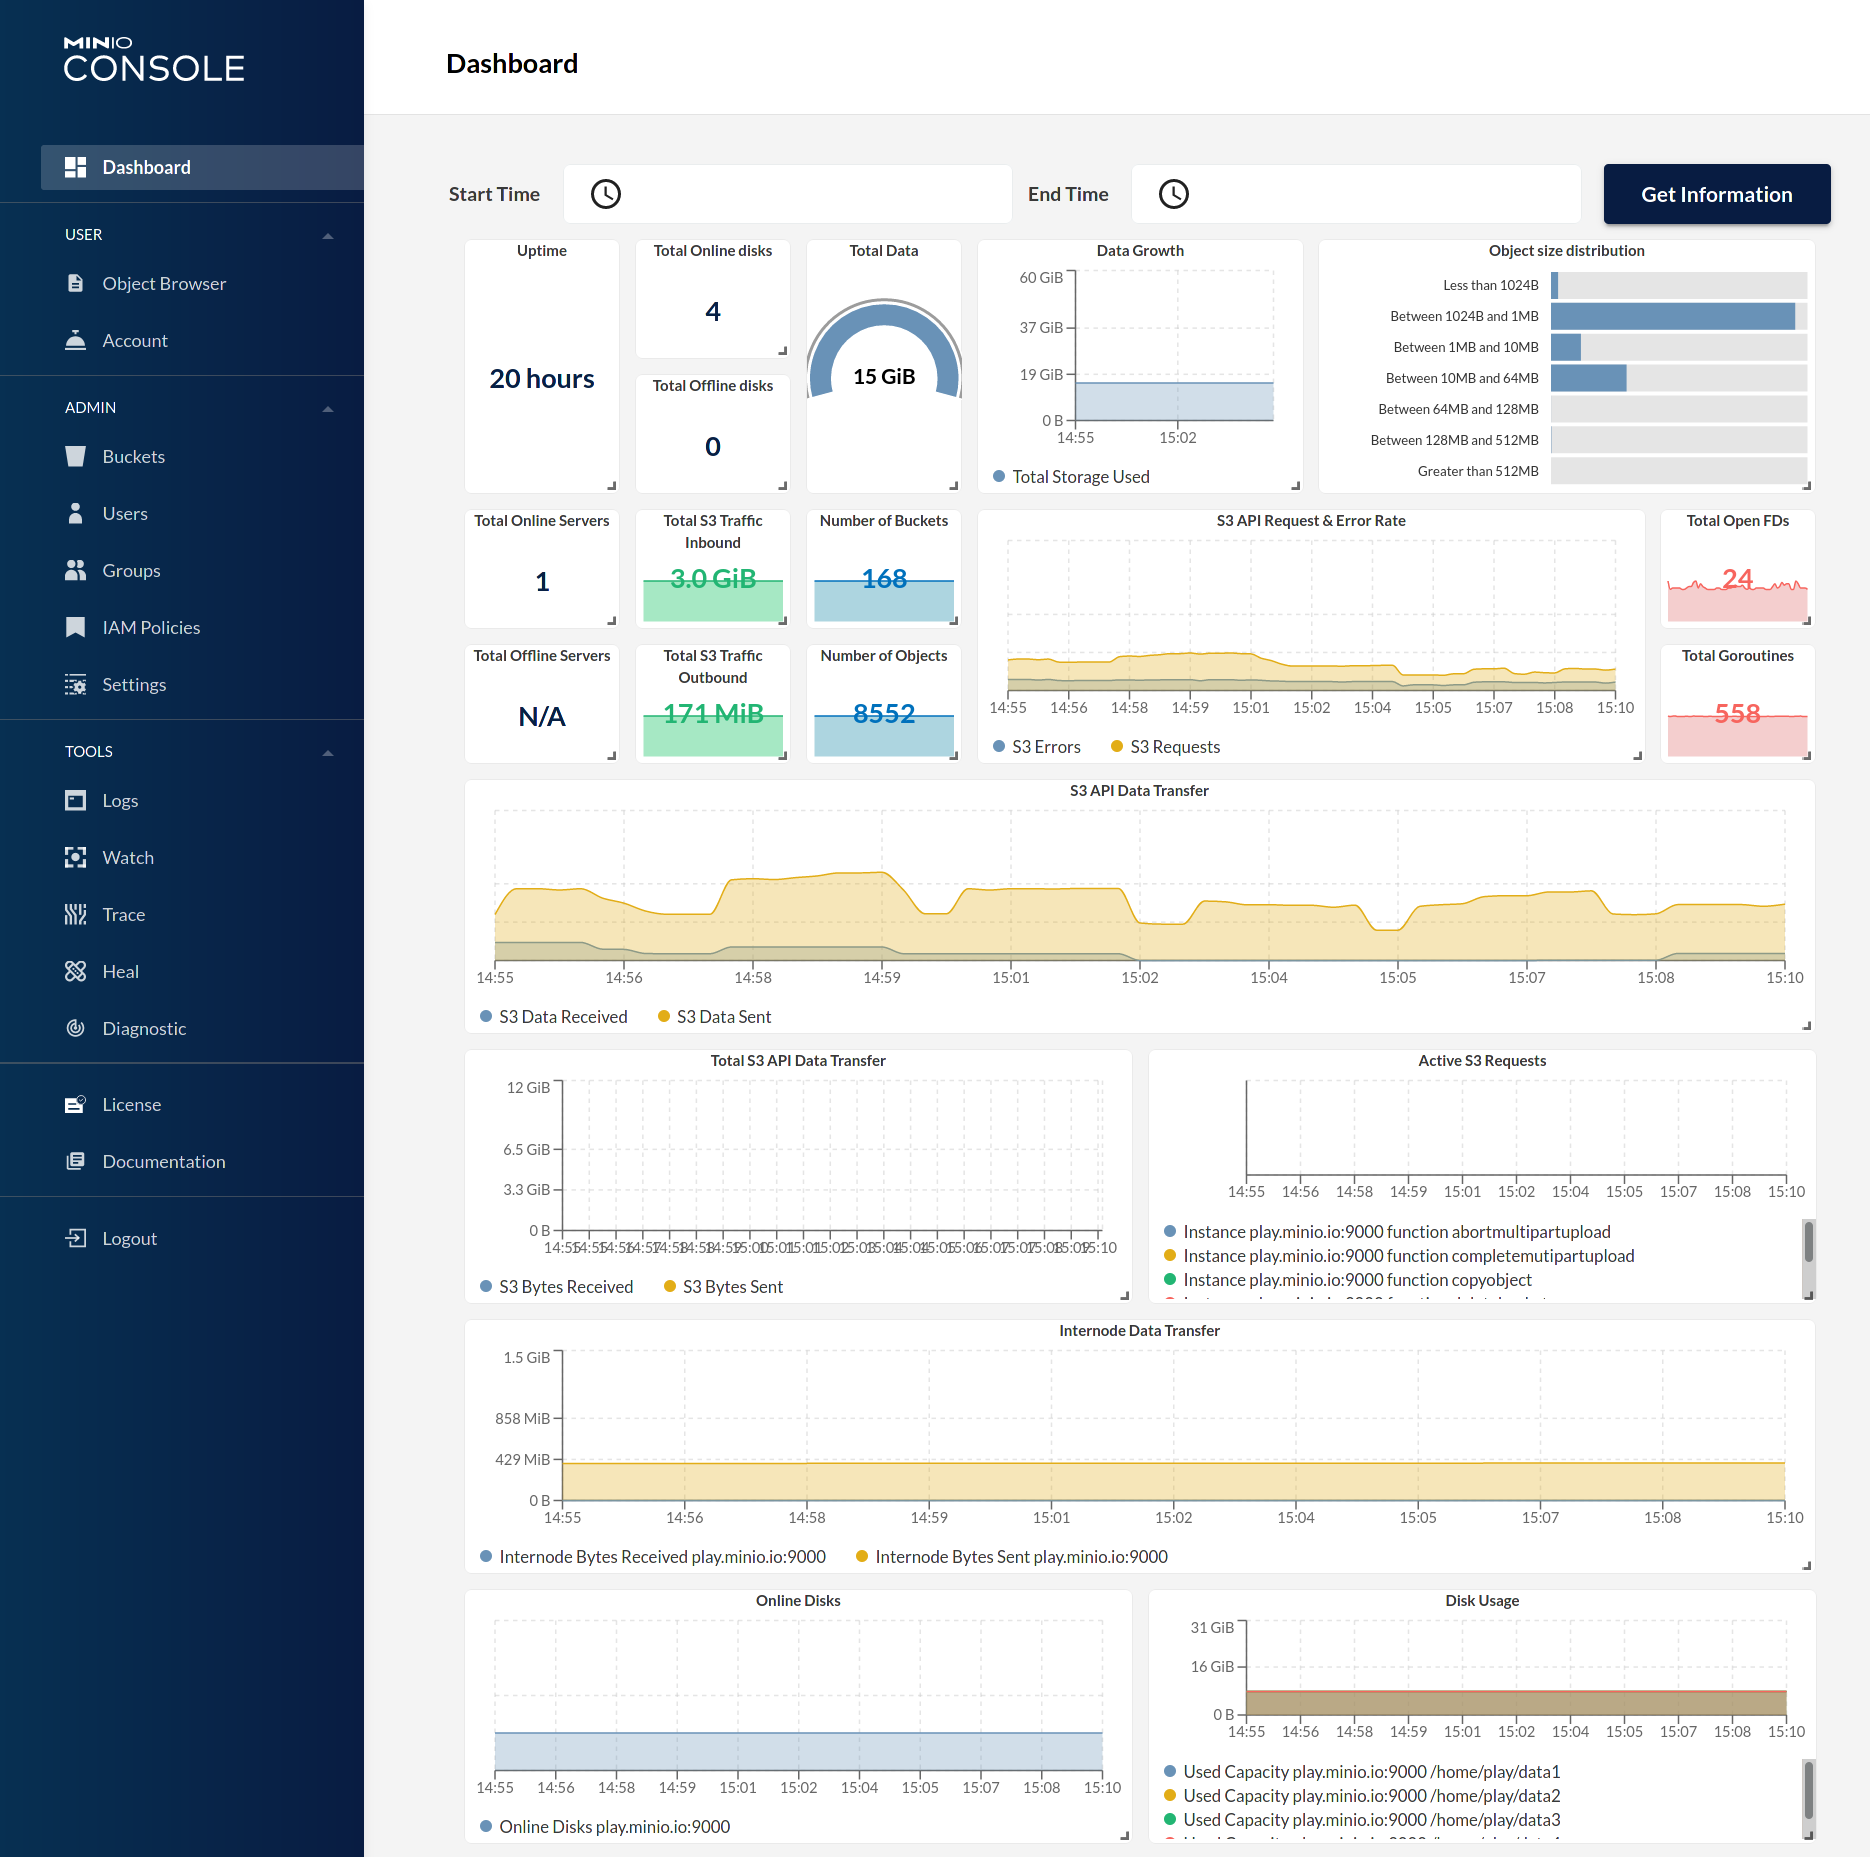
docs/metrics/prometheus/grafana/README.md
Refer to the dashboard [json file here](https://raw.githubusercontent.com/minio/minio/master/docs/metrics/prometheus/grafana/minio-dashboard.json). 
Plain Text - Registered: Sun May 05 19:28:20 GMT 2024 - Last Modified: Thu Mar 28 17:15:39 GMT 2024 - 2.4K bytes - Viewed (0) -
docs/de/docs/advanced/openapi-webhooks.md
Sie definieren auch auf irgendeine Weise, zu welchen **Momenten** Ihre Anwendung diese Requests oder Events sendet.

Und **Ihre Benutzer** definieren auf irgendeine Weise (zum Beispiel irgendwo in einem Web-Dashboard) die **URL**, an die Ihre Anwendung diese Requests senden soll.
Plain Text - Registered: Sun May 05 07:19:11 GMT 2024 - Last Modified: Tue Jan 23 13:06:03 GMT 2024 - 3.3K bytes - Viewed (0) -
docs/en/docs/advanced/openapi-webhooks.md
You also define in some way at which **moments** your app will send those requests or events.

And **your users** define in some way (for example in a web dashboard somewhere) the **URL** where your app should send those requests.
Plain Text - Registered: Sun May 05 07:19:11 GMT 2024 - Last Modified: Thu May 02 22:37:31 GMT 2024 - 2.8K bytes - Viewed (0) -
ci/official/README.md
#   are all settings for the scripts. TF's CI jobs are all made of a combination
#   of these env files.
#
#   If you've clicked on a test result from our CI (via a dashboard or GitHub link),
#   click to "Invocation Details" and find BUILD_CONFIG, which will contain a TFCI
#   value in the "env_vars" list that you can choose to copy that environment.
Plain Text - Registered: Tue May 07 12:40:20 GMT 2024 - Last Modified: Thu Feb 01 03:21:19 GMT 2024 - 8K bytes - Viewed (0) -
docs/metrics/prometheus/README.md
Start (or) Restart Prometheus service by running

```sh
./prometheus --config.file=prometheus.yml
```

Here `prometheus.yml` is the name of configuration file. You can now see MinIO metrics in Prometheus dashboard. By default Prometheus dashboard is accessible at `http://localhost:9090`.
Plain Text - Registered: Sun May 05 19:28:20 GMT 2024 - Last Modified: Fri Apr 12 15:49:30 GMT 2024 - 7.1K bytes - Viewed (0) -
README.md
|  | 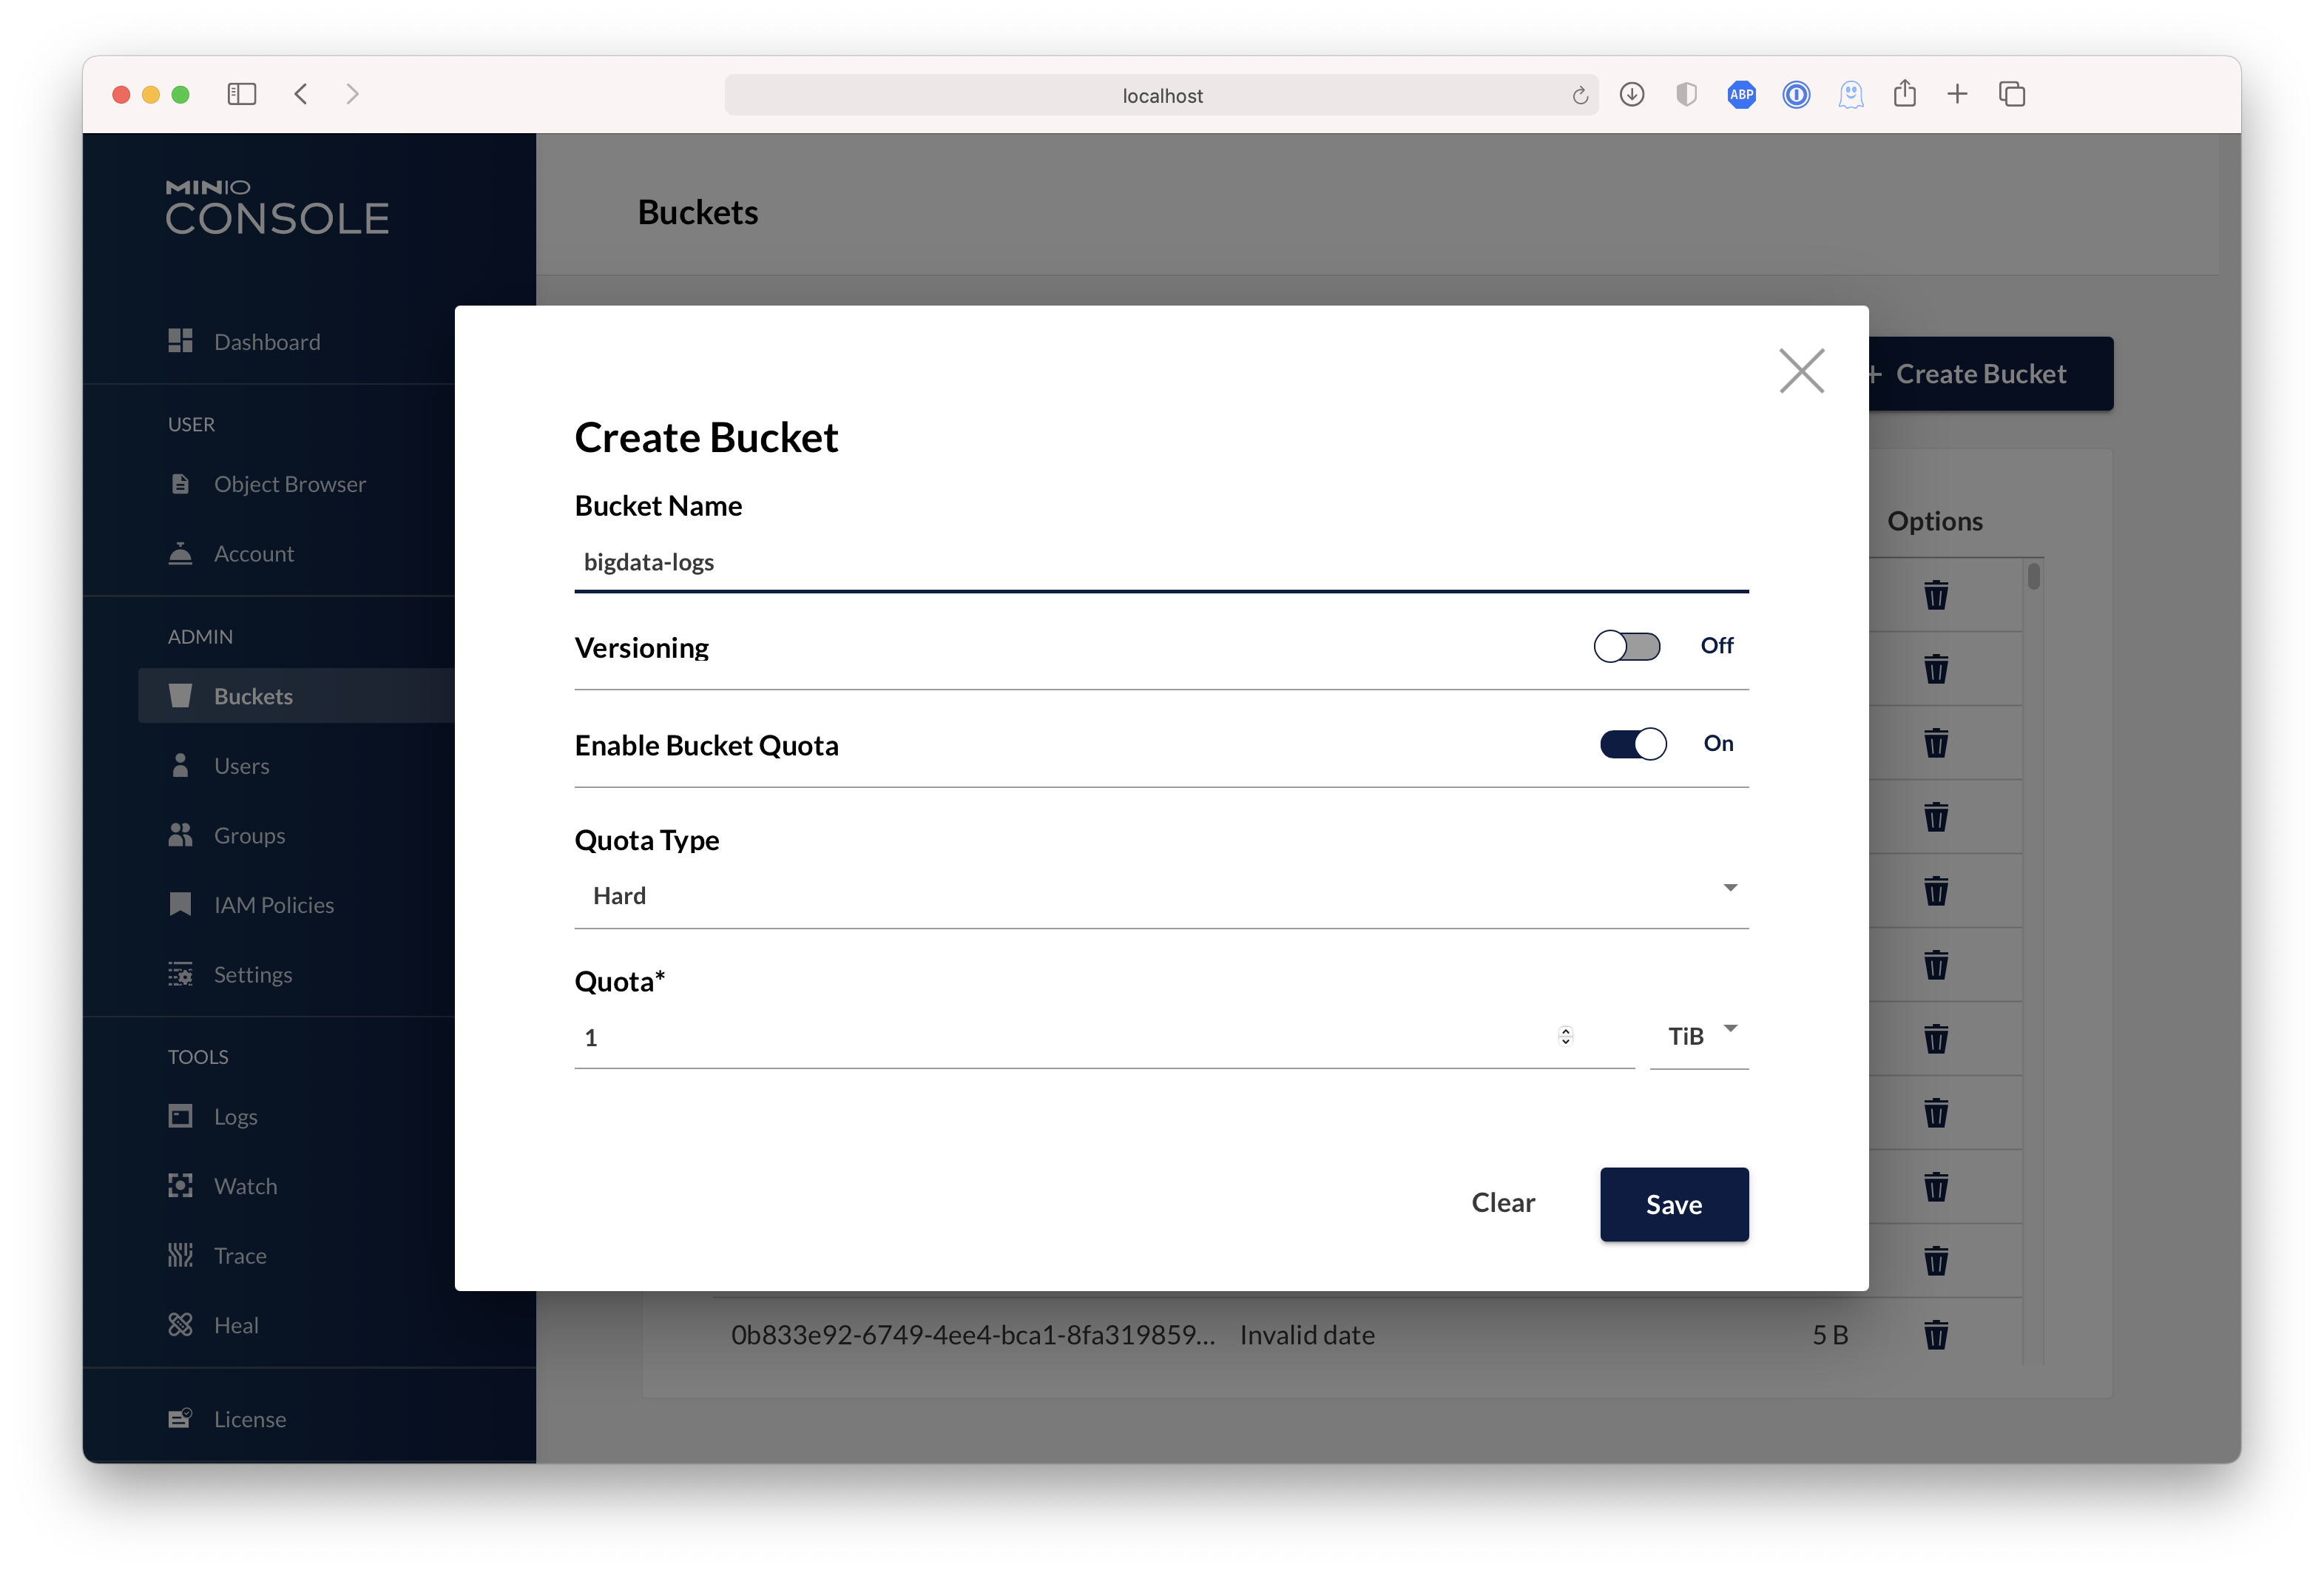 | ## Test using MinIO Client `mc`
Plain Text - Registered: Sun May 05 19:28:20 GMT 2024 - Last Modified: Wed Feb 14 17:51:34 GMT 2024 - 18.7K bytes - Viewed (0) -
docs/de/docs/project-generation.md
* **Vue**-Frontend:
    * Mit Vue CLI generiert.
    * Handhabung der **JWT-Authentifizierung**.
    * Login-View.
    * Nach der Anmeldung Hauptansicht des Dashboards.
    * Haupt-Dashboard mit Benutzererstellung und -bearbeitung.
    * Bearbeitung des eigenen Benutzers.
    * **Vuex**.
    * **Vue-Router**.
    * **Vuetify** für schöne Material-Designkomponenten.
    * **TypeScript**.
Plain Text - Registered: Sun May 05 07:19:11 GMT 2024 - Last Modified: Sat Mar 30 18:14:36 GMT 2024 - 6.5K bytes - Viewed (0) -
README.md
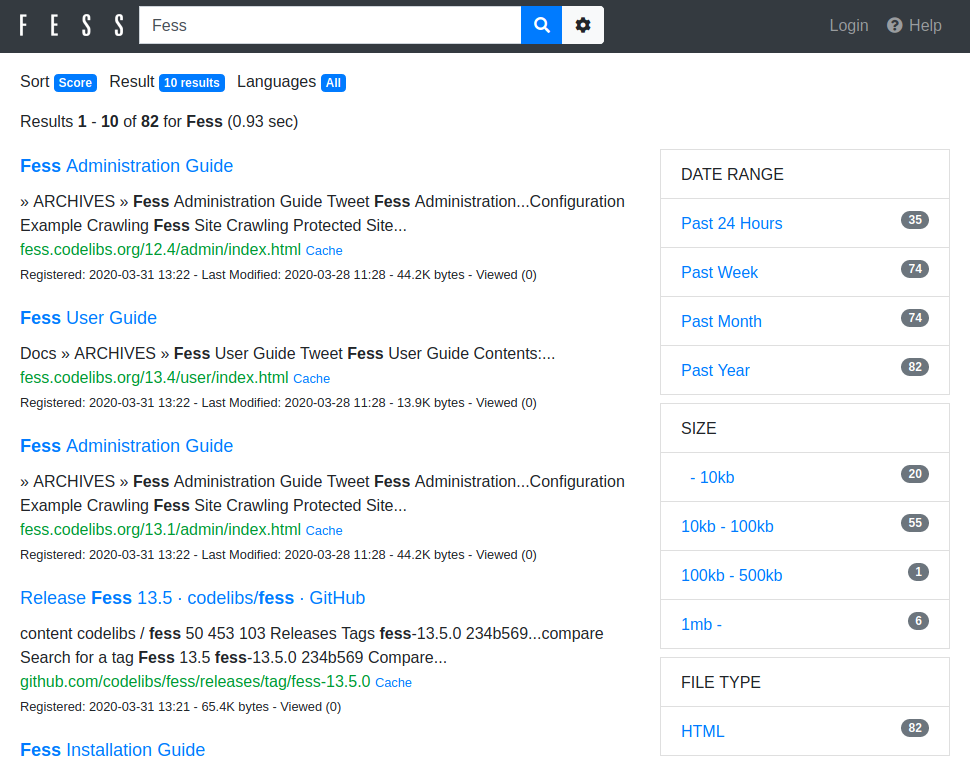 - Admin UI: http://localhost:8080/admin/ (default username/password is admin/admin) 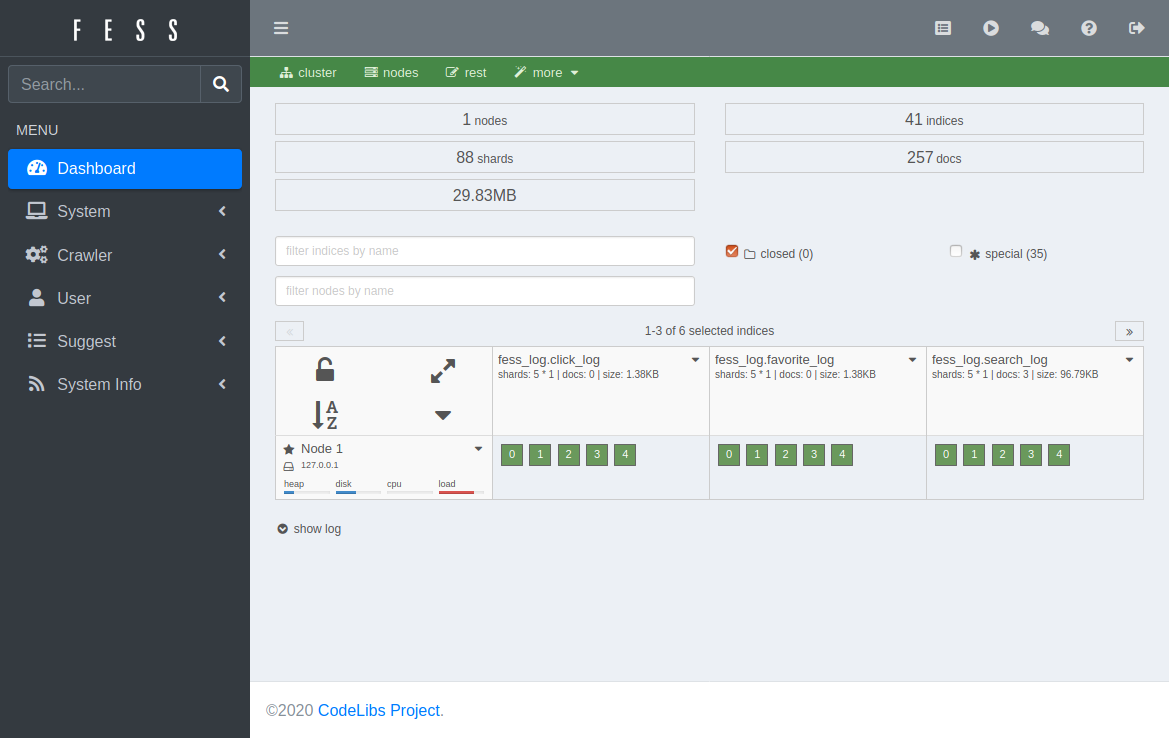 You can register crawling targets in the Admin UI on the (Web, File, Data Store) crawler configuration pages, and then start the Crawler manually on the [Scheduler page](https://fess.codelibs.org/14.12/admin/scheduler-guide.html).
Plain Text - Registered: Mon May 06 08:04:11 GMT 2024 - Last Modified: Sun Feb 25 00:40:07 GMT 2024 - 7.6K bytes - Viewed (0) -
.github/CODEOWNERS
platforms/documentation/docs/src/docs/userguide/core-plugins/base_plugin.adoc                 @gradle/bt-devrel-education @gradle/bt-jvm
platforms/documentation/docs/src/docs/userguide/core-plugins/build_dashboard_plugin.adoc      @gradle/bt-devrel-education @gradle/bt-jvm
platforms/documentation/docs/src/docs/userguide/core-plugins/build_init_plugin.adoc           @gradle/bt-devrel-education @gradle/bt-jvm
Plain Text - Registered: Wed May 08 11:36:15 GMT 2024 - Last Modified: Wed Apr 24 15:52:09 GMT 2024 - 9.8K bytes - Viewed (0) -
CHANGELOG/CHANGELOG-1.8.md
* Updated Dashboard add-on to version 1.8.0: The Dashboard add-on now deploys with https enabled. The Dashboard can be accessed via kubectl proxy at http://localhost:8001/api/v1/namespaces/kube-system/services/https:kubernetes-dashboard:/proxy/. The /ui redirect is deprecated and will be removed in 1.10. ([#53046](https://github.com/kubernetes/kubernetes/pull/53046), [@m...
Plain Text - Registered: Fri May 03 09:05:14 GMT 2024 - Last Modified: Tue Feb 20 15:45:02 GMT 2024 - 312.2K bytes - Viewed (1)