- Sort Score
- Num 10 results
- Language All
Results 1 - 3 of 3 for dashboard (0.04 seconds)
-
docs/metrics/prometheus/grafana/node/minio-node.json
        },
        "enable": true,
        "hide": true,
        "iconColor": "rgba(0, 211, 255, 1)",
        "name": "Annotations & Alerts",
        "type": "dashboard"
      }
    ]
  },
  "description": "MinIO Nodes Grafana Dashboard - https://min.io/",
  "editable": true,
  "fiscalYearStartMonth": 0,
  "gnetId": 15306,
  "graphTooltip": 0,
  "id": 267,
  "links": [
    {
Created: Sun Dec 28 19:28:13 GMT 2025 - Last Modified: Mon Aug 04 01:46:49 GMT 2025 - 22.5K bytes - Click Count (0) -
CHANGELOG/CHANGELOG-1.2.md
trigger scaling up and down the number of pods in your application.
  * <strong>New GUI</strong> (dashboard) allows you to get started quickly and enables the same
functionality found in the CLI as a more approachable and discoverable way of
interacting with the system. Note: the GUI is enabled by default in 1.2 clusters.
Created: Fri Dec 26 09:05:12 GMT 2025 - Last Modified: Fri Dec 04 06:36:19 GMT 2020 - 41.4K bytes - Click Count (0) -
cmd/testdata/xl-meta-merge.zip
hostname of the MinIO server to allow the Console to use the MinIO server API using the TLS certificate. For example: `export MINIO_SERVER_URL="https://minio.example.net"` | Dashboard | Creating a bucket | | ---------- | ---------- | | 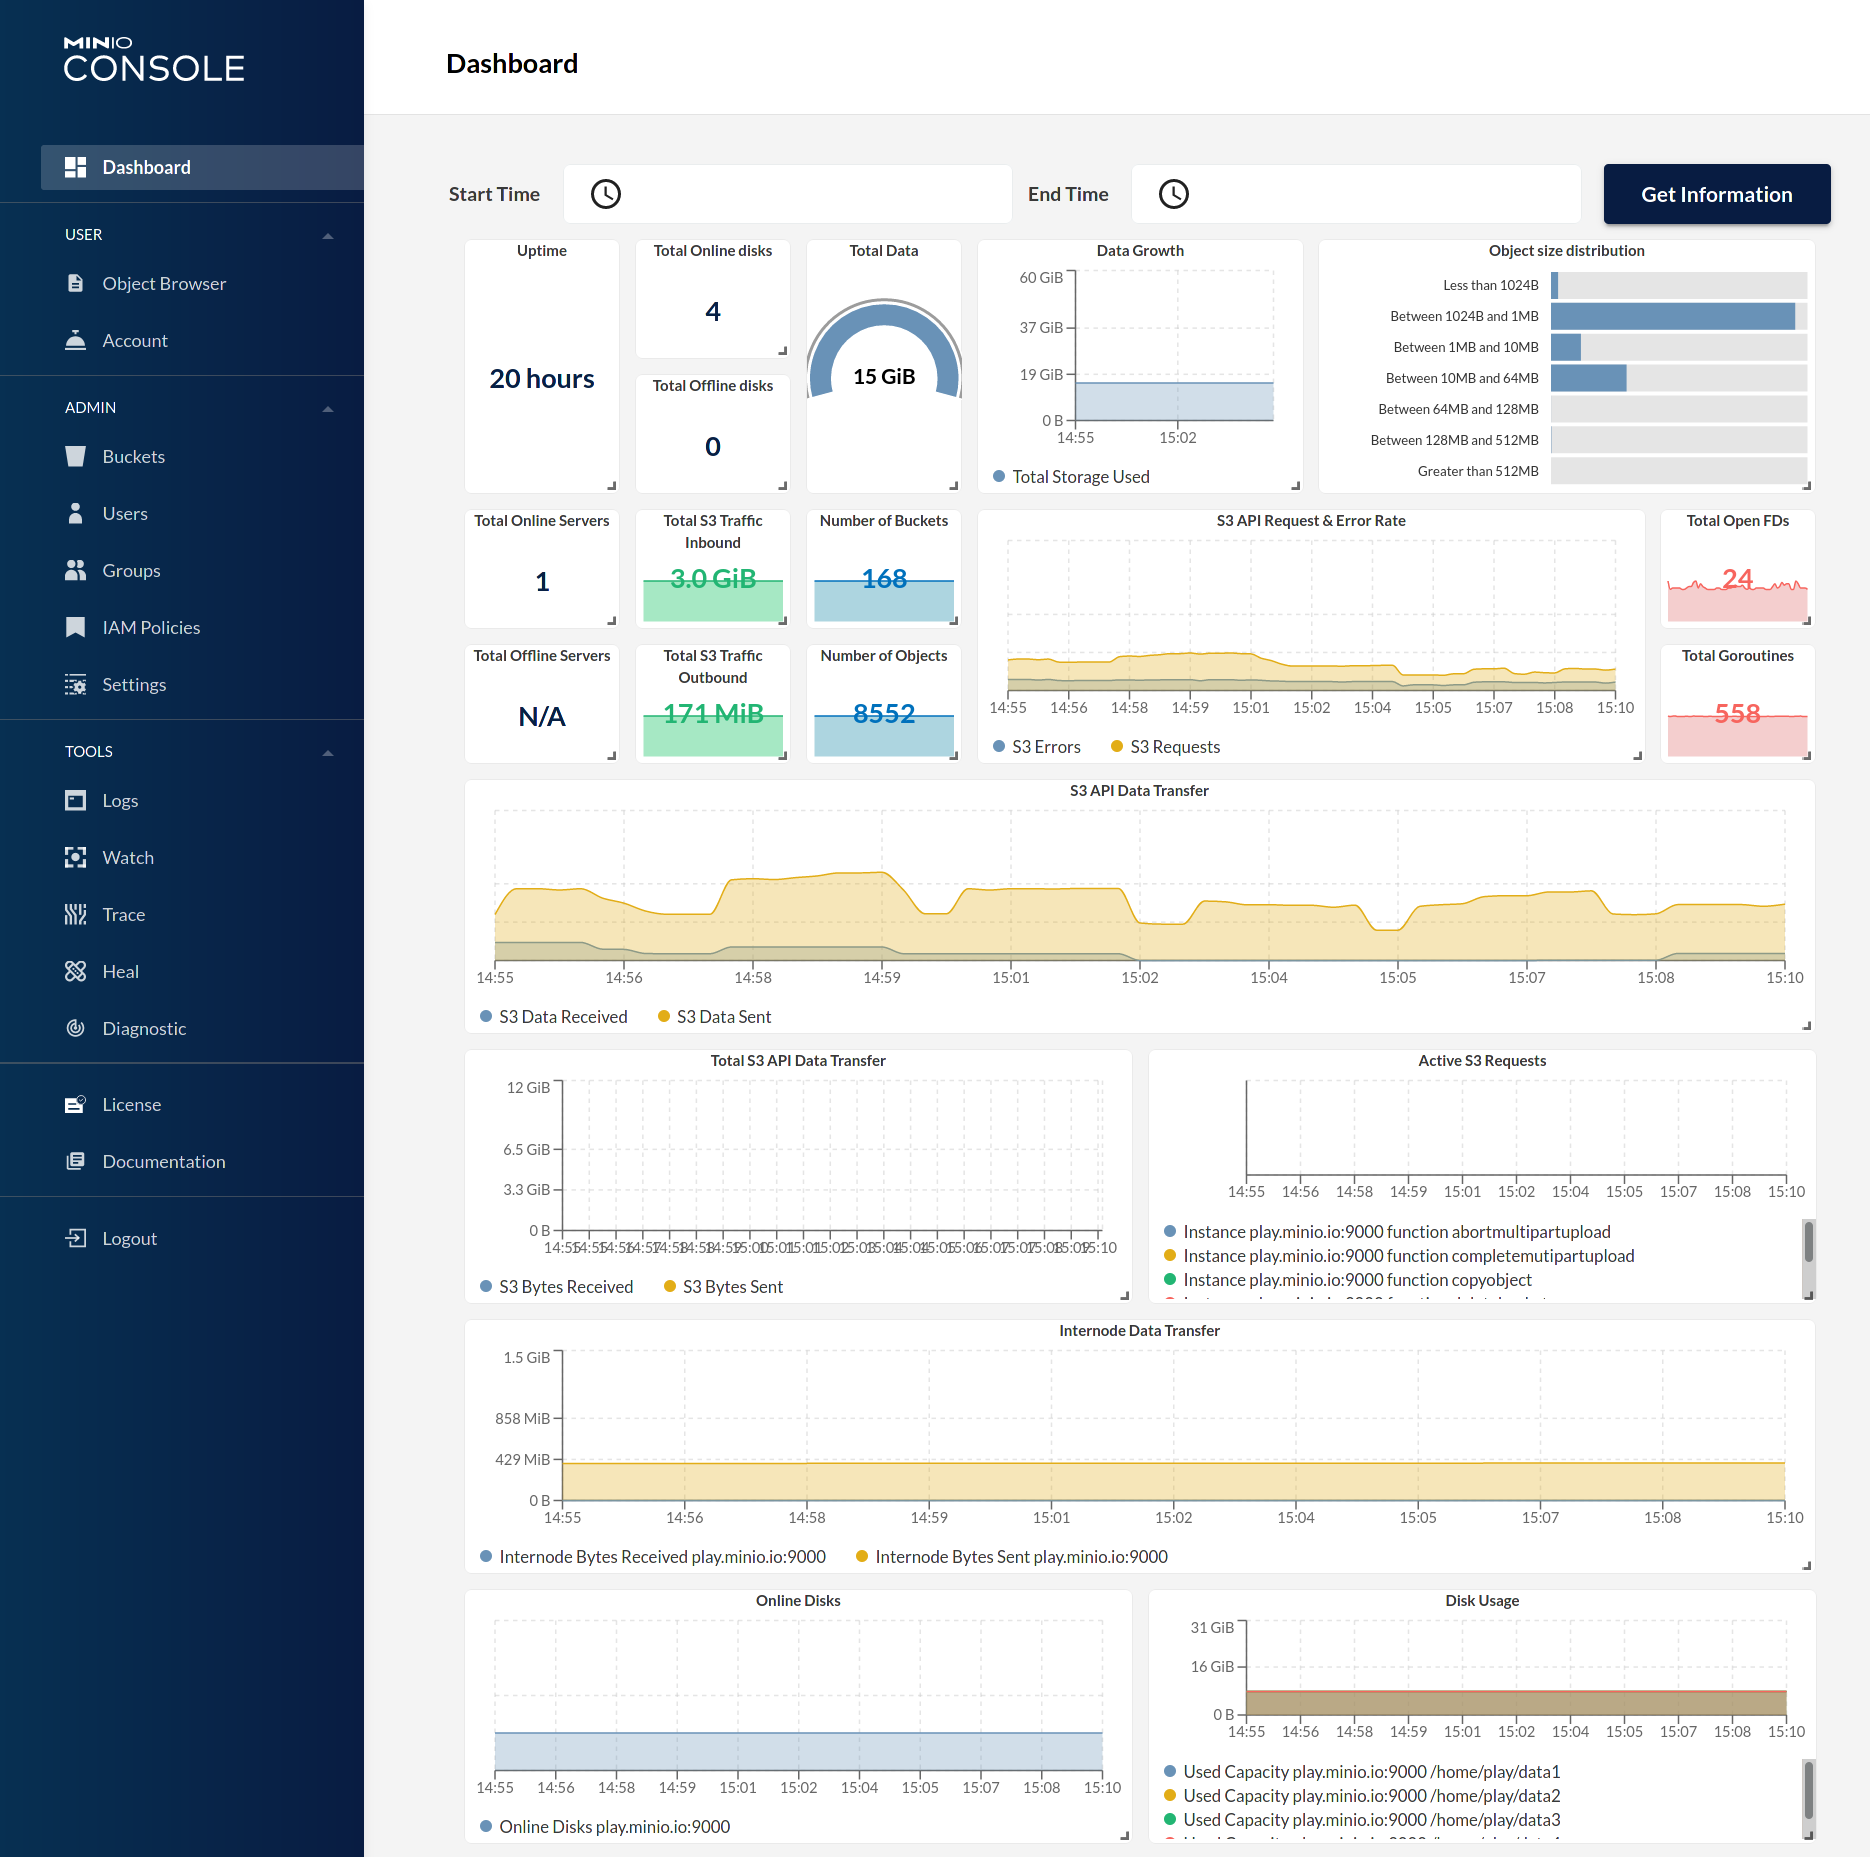 | 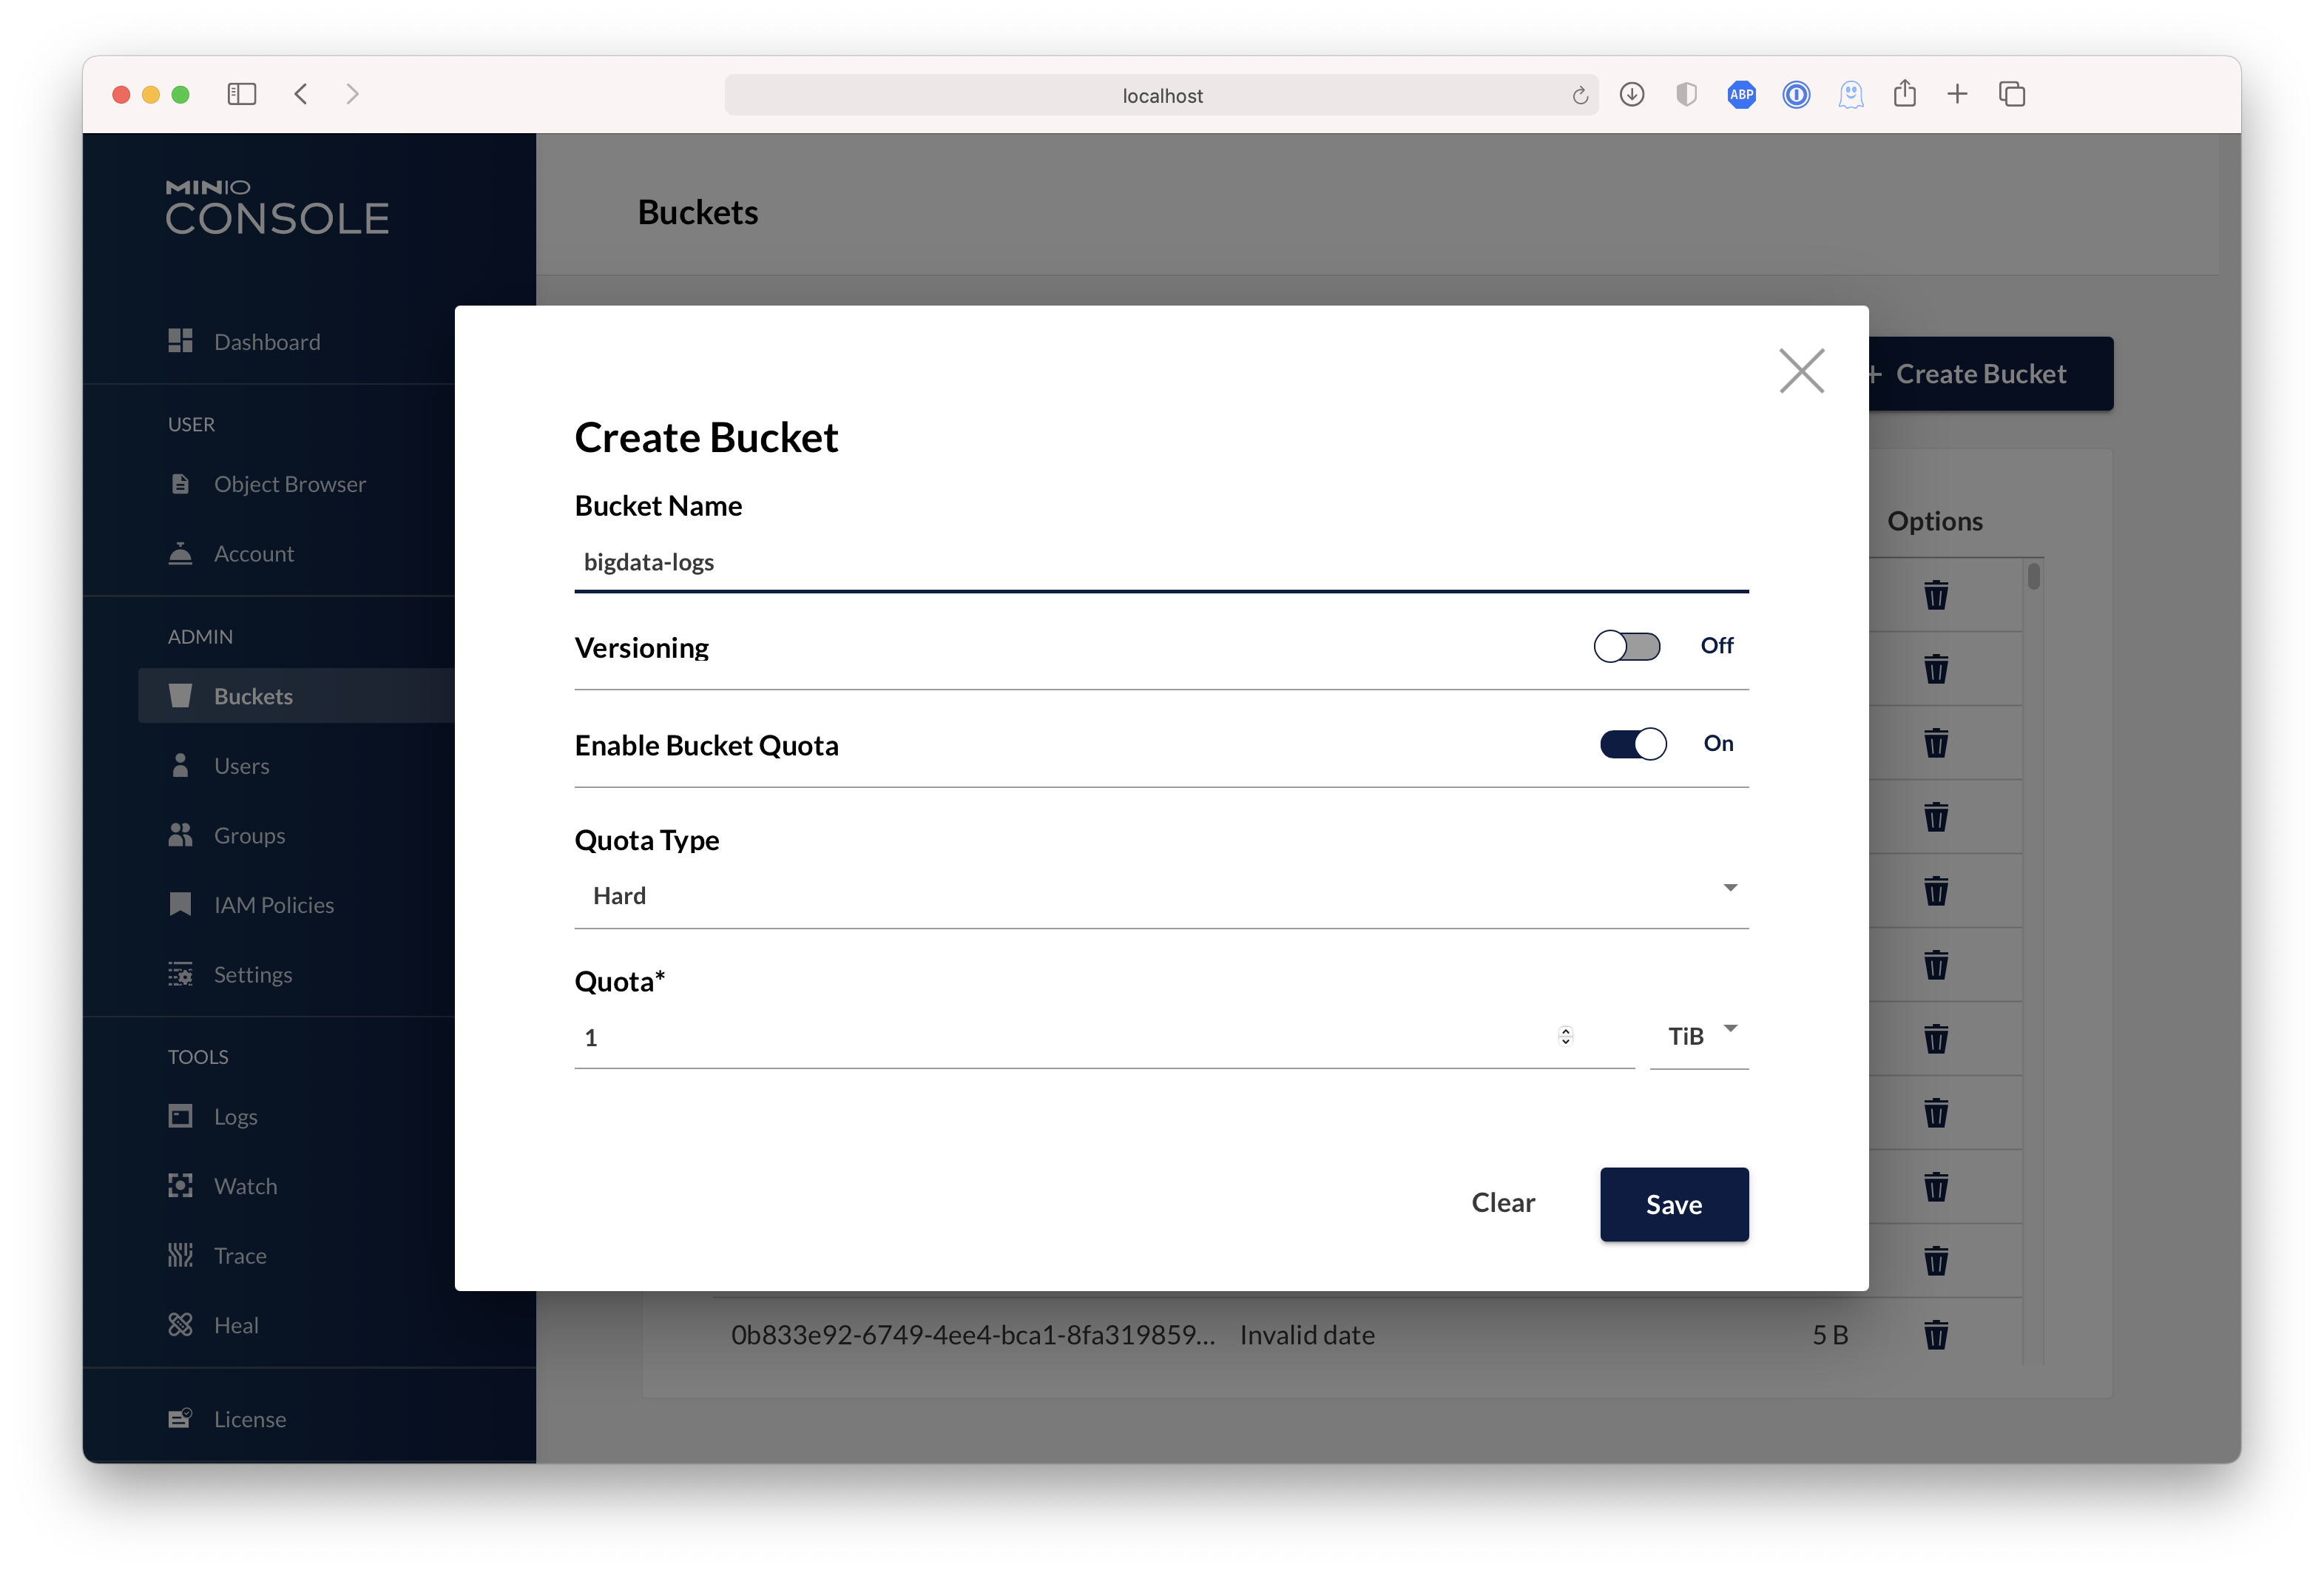 | ## Test using MinIO Client `mc` `mc` provides a modern alternative to UNIX commands like...
Created: Sun Dec 28 19:28:13 GMT 2025 - Last Modified: Fri Mar 08 17:50:48 GMT 2024 - 30.2K bytes - Click Count (0)